I watched in amazement as gold rose US$10, US$20, US$35 and US$45 yesterday and into the evening and then saw US$+74 Monday morning.
The gold bulls would be cheering.
Up 2.7%.
A 2.7% rise is a big daily move, especially in gold.
Market size in now US$26.5 trillion with US$703 billion added today and US$8.5 trillion since January 1, 2025.
So a few billion US$ buying today made US$703 billion.
This gold business is a real money maker!
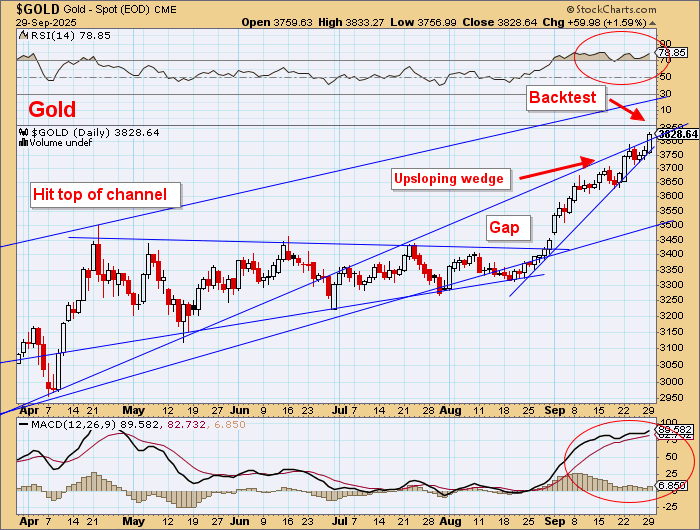
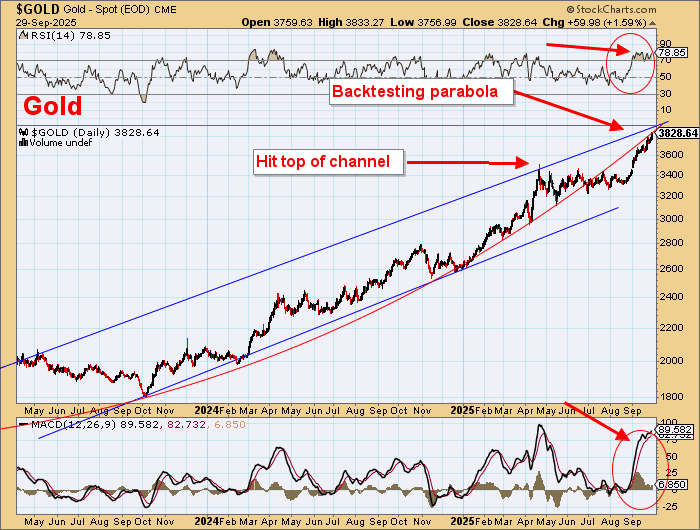
Gold could now move higher to test the top of the channel and this could coincide with US$4,000 and the parabola backtest.
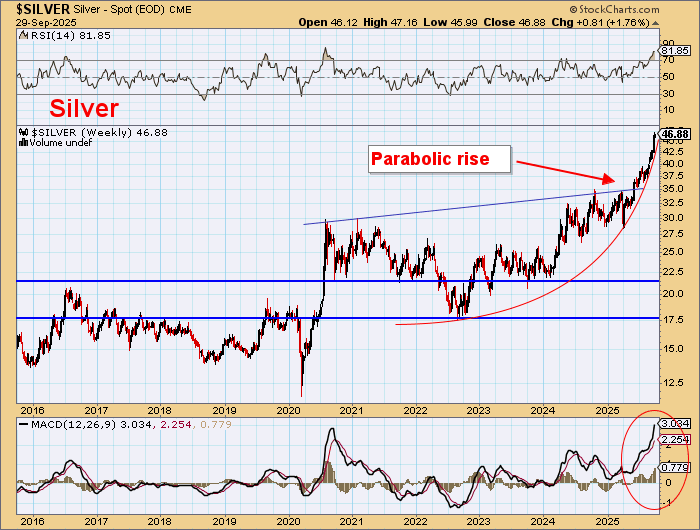
And possibly US$50 for silver.
And then what?
Upsloping wedge:
Backtesting parabola:
So, do I have this wrong?
Maybe.
However, the surrounding environment does still not support this strong gold price.
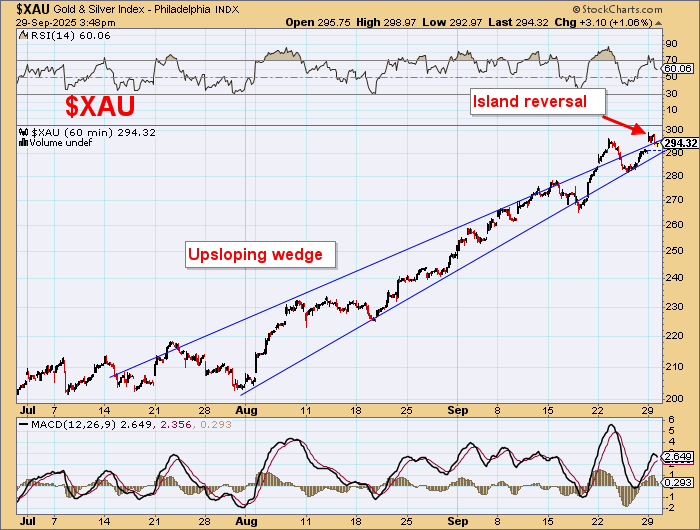
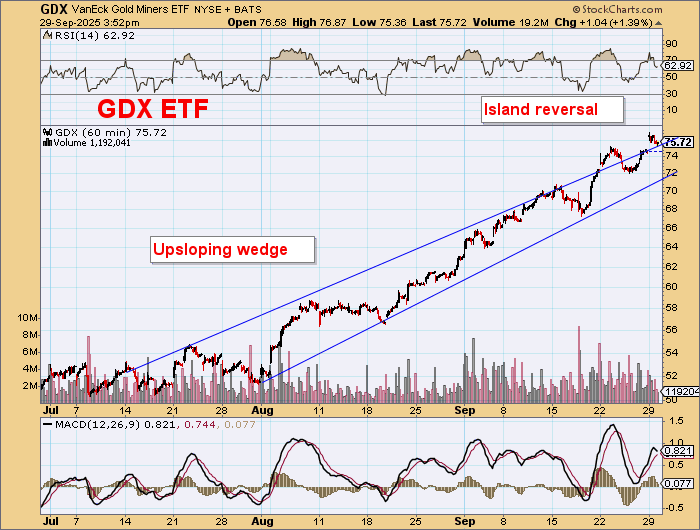
Just look at the overnight action in the gold stocks below.
Gold Stocks
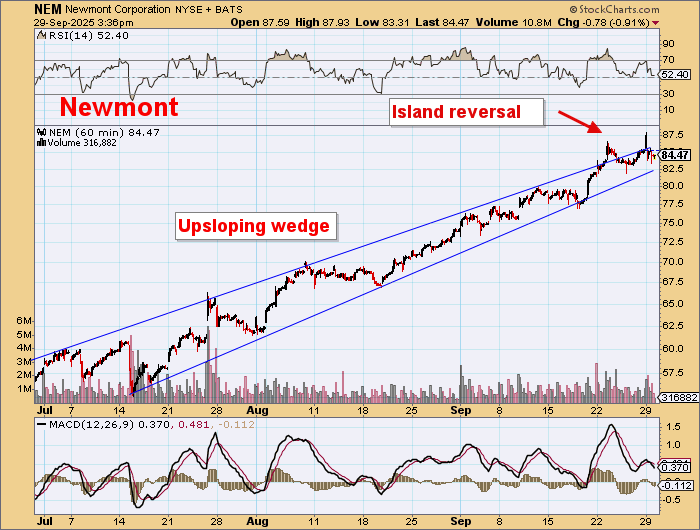
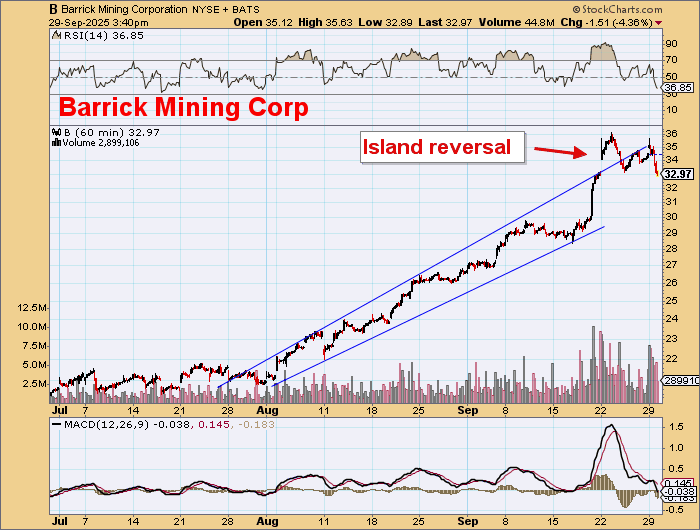
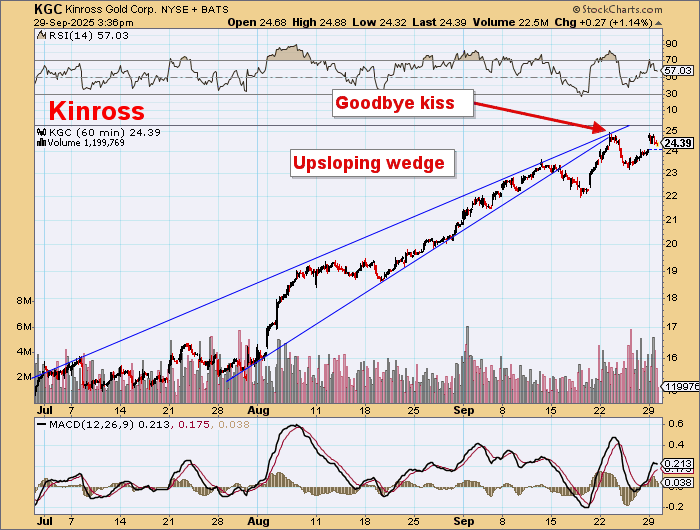
- Upsloping wedges in these indices.
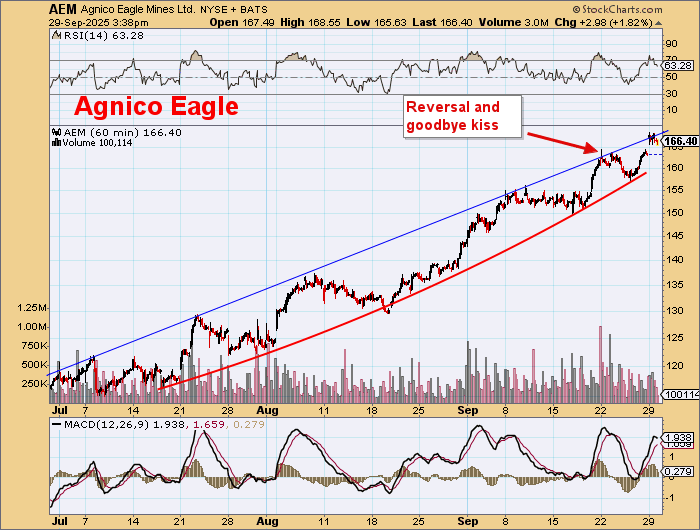
- Island reversals.
- New highs but closes at the lows.
Look at these majors.
These aren’t inspiring results for a 2.7% rise in gold.
Big volumes look like distribution.
Not the signs of another upleg.
Newmont Corp. (NEM:NYSE; NGT:TSX; NEM:ASX) has a new high but closed lower.
Barrick Mining Corp. (ABX:TSX; B:NYSE) has no new high — closes at lows — possible island reversal? Ugly.
Agnico Eagle Mines Ltd. (AEM:TSX; AEM:NYSE) has a new high, but is closing at lows. Island reversal?
Kinross Gold Corp. (K:TSX; KGC:NYSE) has no new high, but closed at lows. Island reversal?
Barrick CEO Mark Bristow retires — most certainly at the top here!
Great timing.
Silver
Silver is trying to get to the previous US$50 high.
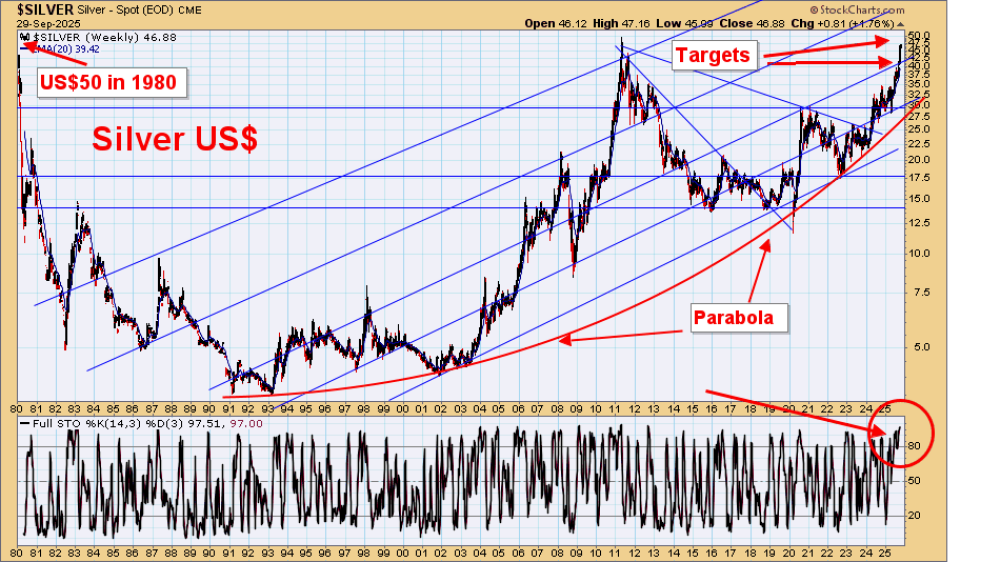
Parabolic rise phase. How high?
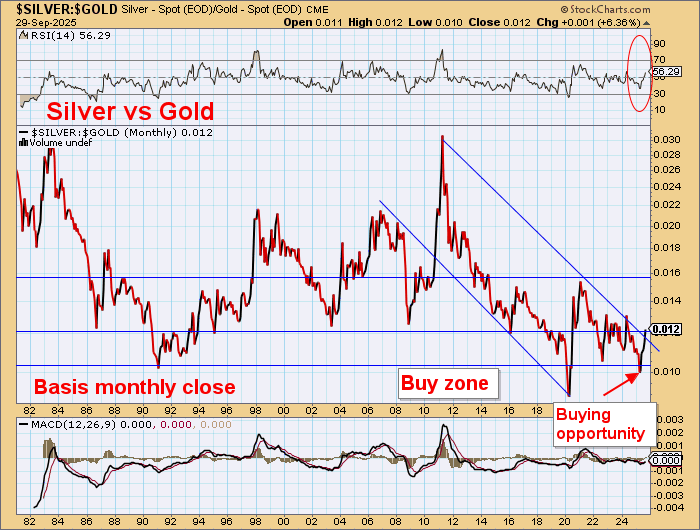
This looks like silver is to rise versus gold. Silver up or gold down?
Head the markets.
| Want to be the first to know about interesting Gold investment ideas? Sign up to receive the FREE Streetwise Reports’ newsletter. | Subscribe |