Gold Price Talking Points
The price of gold clears the former-support zone around the July low ($1681) as it extends the series of higher highs and lows from last week, with bullion on the cusp of testing the September high ($1735) as it trades above the 50-Day SMA ($1724).
Gold Price Climbs Above 50-Day SMA to Approach September High
The price of gold climbs to fresh weekly high ($1730) amid the ongoing weakness in the US Treasury yields, and the precious metal may stage a larger recovery over the coming days as the Relative Strength Index (RSI) continues to recover from oversold territory.
As a result, the price of gold may attempt to retrace the decline from the August high ($1808) as the bearish momentum abates, but it remains to be seen if the advance from the yearly low ($1615) is the beginning of a major reversal as the moving average still reflects a negative slope.
Looking ahead, fresh developments coming out of the US may influence the price of gold as the Non-Farm Payrolls (NFP) report is anticipated to show a further improvement in the labor market, with the economy expected to add 250K jobs in September following the 315K expansion the month prior.
Evidence of a resilient labor market may encourage the Federal Reserve to retain its approach in combating inflation as the Personal Consumption Expenditure (PCE) Price Index points to persistent price growth, and the price of gold may face headwinds throughout the remainder of the year as Chairman Jerome Powell and Co. pursue a restrictive policy.
With that said, the price of gold may push above the September high ($1735) as it extends the series of higher highs and lows from last week, but the precious metal may mirror the price action from August if it struggles to hold above the 50-Day SMA ($1724).
Gold Price Daily Chart
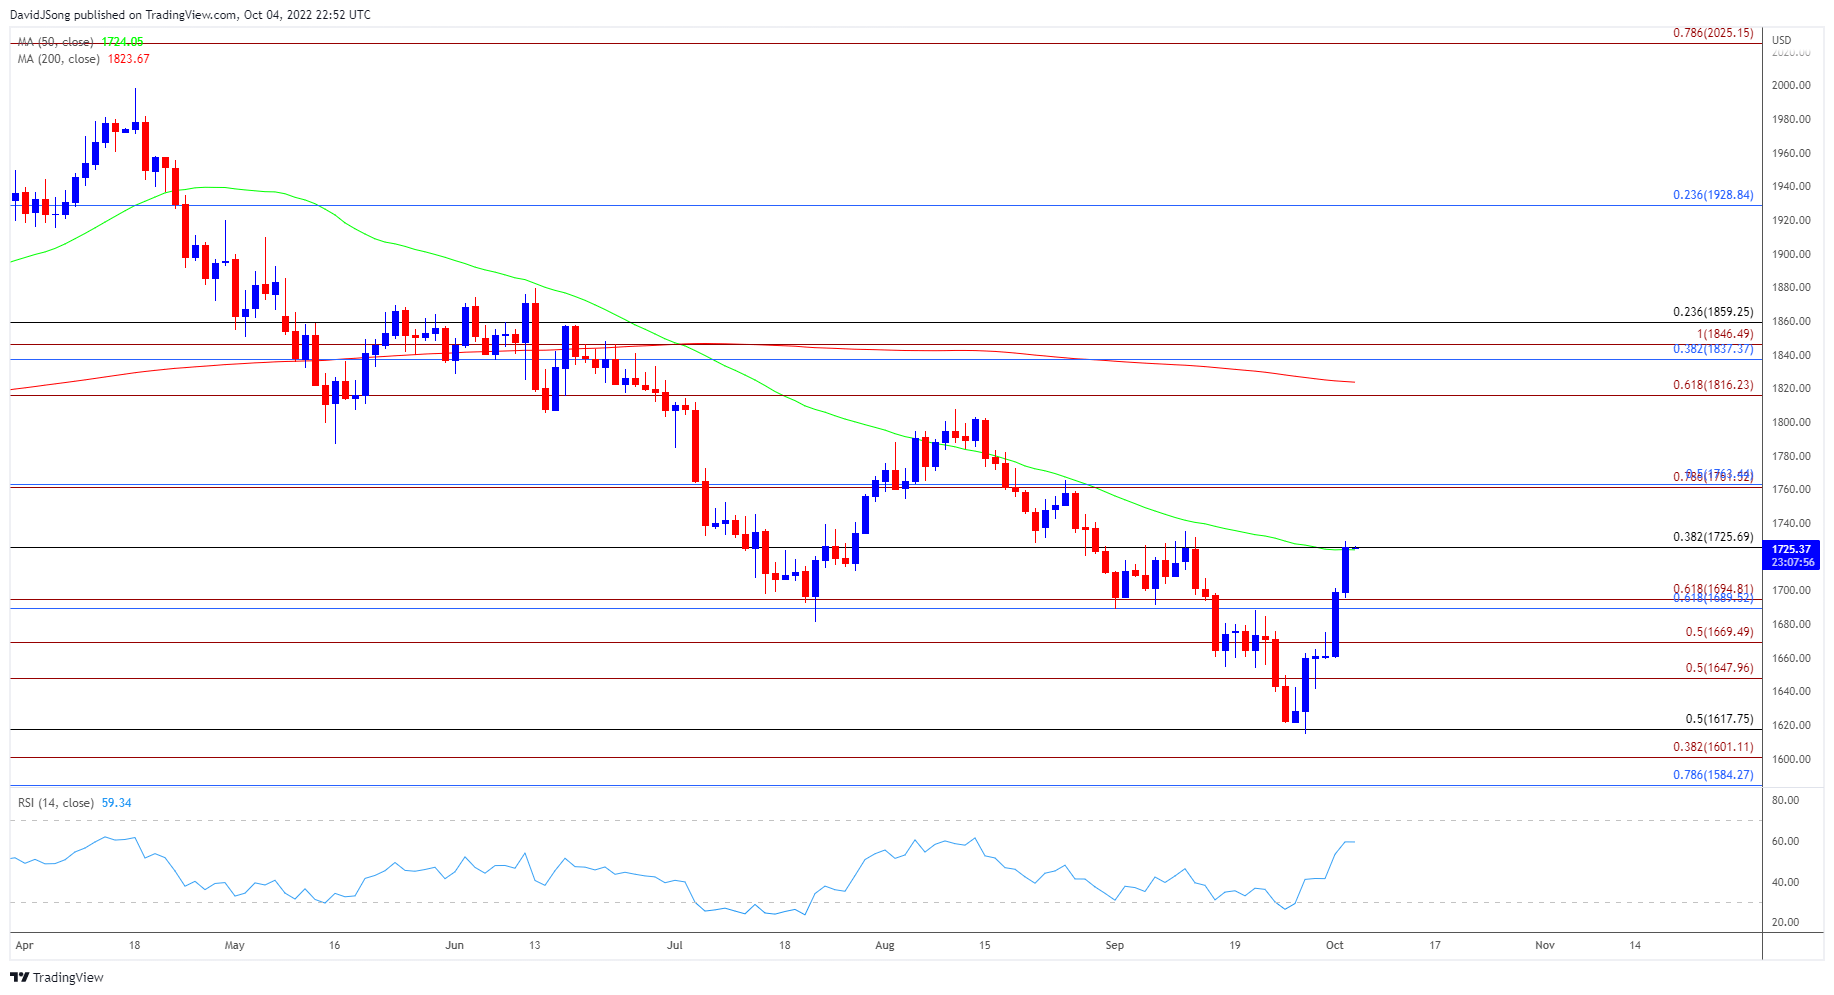
Source: Trading View
- The price of gold trades above the 50-Day SMA ($1726) as the Relative Strength Index (RSI) continues to recover from oversold territory, with a break above the September high ($1735) bringing the $1762 (78.6% expansion) to $1763 (50% retracement) area back on the radar.
- The price of gold may attempt to retrace the decline from the August high ($1808) as it trades above the 50-Day SMA ($1724), but the precious metal may track the negative slope in the moving average if it struggles to hold above the $1726 (38.2% retracement) region.
- Gold may mirror the price action from August if it fails to hold above the moving average, with a move below the $1690 (61.8% retracement) to $1695 (61.8% expansion) area opening up the $1670 (50% expansion) region.
Trading Strategies and Risk Management
Becoming a Better Trader
Recommended by David Song
— Written by David Song, Currency Strategist
Follow me on Twitter at @DavidJSong