Technical Analyst Clive Maund takes a look at gold’s charts through the years to explain why he believes another upleg is imminent.
After almost four years of going nowhere, gold has this month broken out into what looks set to be by far its biggest bull market to date, and it would be surprising if it wasn’t given the fundamental outlook which is for currency and societal collapse, implosion of the debt and derivatives markets and war and general chaos and mayhem as the prelude to an intended global government involving the imposition of the CBDC (Central Bank Digital Currency) system as part of a total control grid.
Fortunately for investors, the situation is now very clear with respect to gold and gold investments and easy and simple to elucidate.
Our very long-term chart going all the way back to the start of the year 2000 shines a giant searchlight on gold’s situation, quickly revealing that beyond the great 2000s bull market, the price has marked out a fine example of a gigantic Cup and Handle base which is of such a magnitude that it can support a massive bull market, which as mentioned above is likely to be of unprecedented proportions. The reason for this update now is that it has just this month, at last, broken out of the top of this completed base pattern, so for investors in the sector, there is still almost everything to go for.
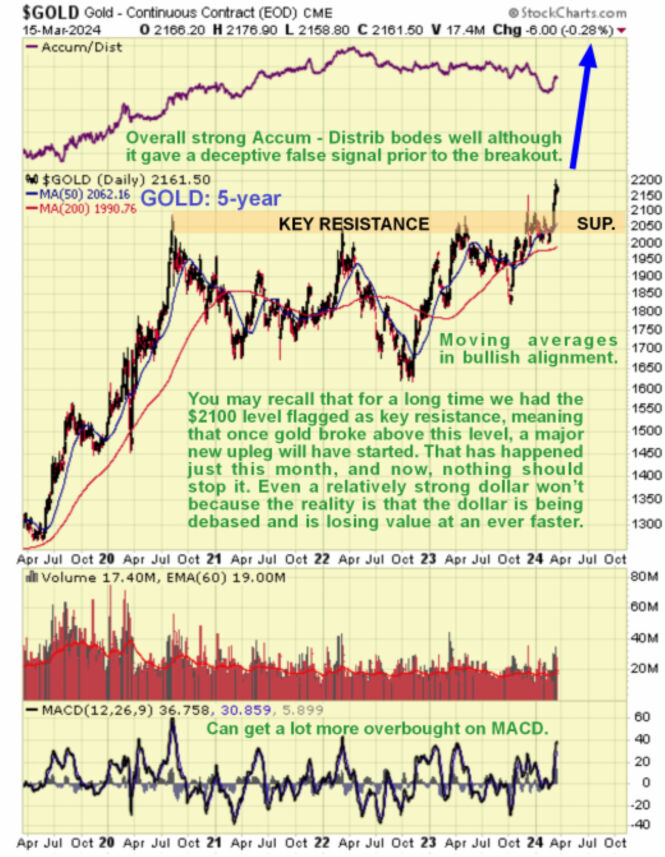
Now we will zoom in to examine the latter part of this gigantic base pattern using a 5-year chart, which shows the strong rally in 2019 and 2020 to form the right side of the Cup and then the lengthy Handle trading range that followed, which continued right up to the end of last month. This chart makes clear the importance of the resistance level marking the horizontal upper boundary of the Handle trading range, as the price got turned back from the $2050 – $2100 level on four occasions, but the last time this happened, early in December, the bullishly aligned moving averages were at hand, not far beneath to provide support and limit the reaction that followed.
The Accumulation line fell hard on this retreat, however, giving a false signal that temporarily fooled us (me), and this may somehow have been staged to throw people off before the big move, or it may simply be that it did have negative implications that were quickly eclipsed by subsequent developments. In any event, gold made the big breakout on good volume this month which we will now look at in more detail on the 6-month chart.
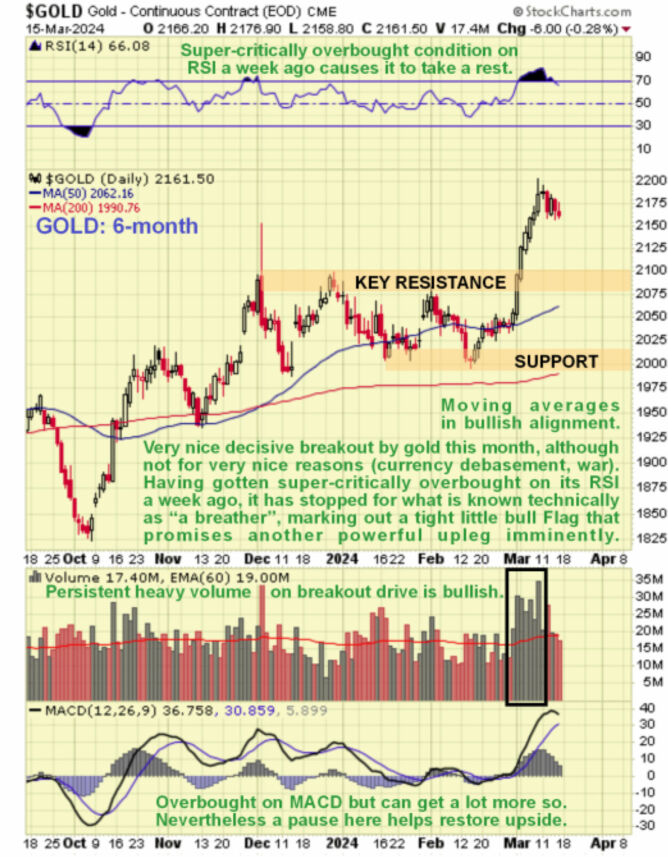
On the 6-month chart, we can see to advantage of gold’s powerful and decisive breakout on persistent strong volume and how it took it sharply higher to become super-critically overbought on its RSI indicator which is why it has stopped to “get its breath back” this past week.
The resistance at $2100 has now decisively fallen, and with momentum, positive and moving averages in strongly bullish alignment, gold is now a bull market, and for the reasons stated above it is likely to be one for the record books.
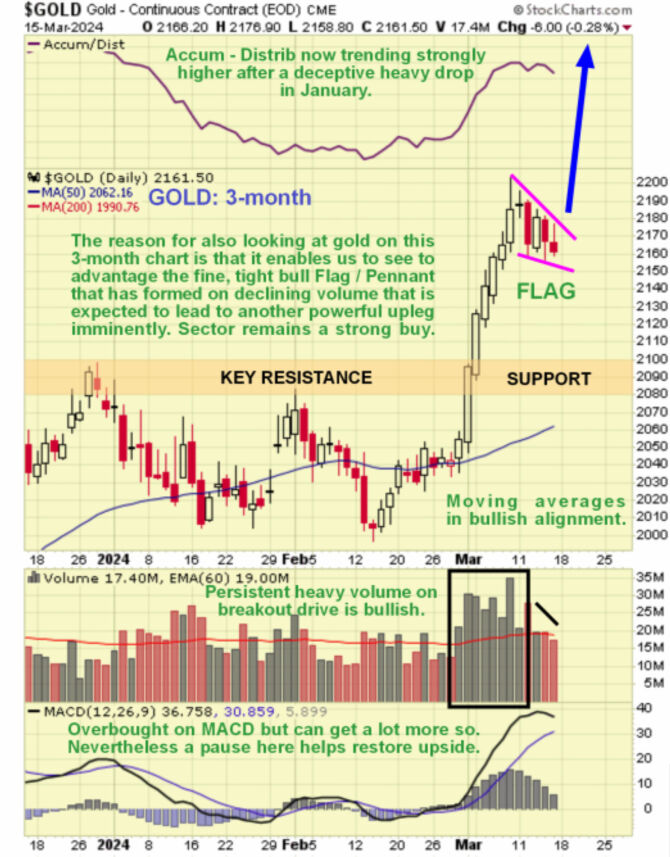
We will now proceed to look at gold again, this time on a shorter-term 3-month chart, the reason being to examine the price / volume action this month in an effort to determine what is going to happen next. The pattern that has formed as the price has reacted back slightly does not look like a top–price / volume action. It strongly suggests that it is a bull Flag / Pennant that will be followed by another strong upleg, similar in magnitude to the one that led into it and perhaps even stronger as gold is now in “open country” and moving away from the gravitational pull of the giant trading range.
Volume has eased back in a most satisfactory manner during the past week, with the MACD histogram (bars) also easing back considerably, suggesting that another big upleg is not just likely to happen soon but imminent.
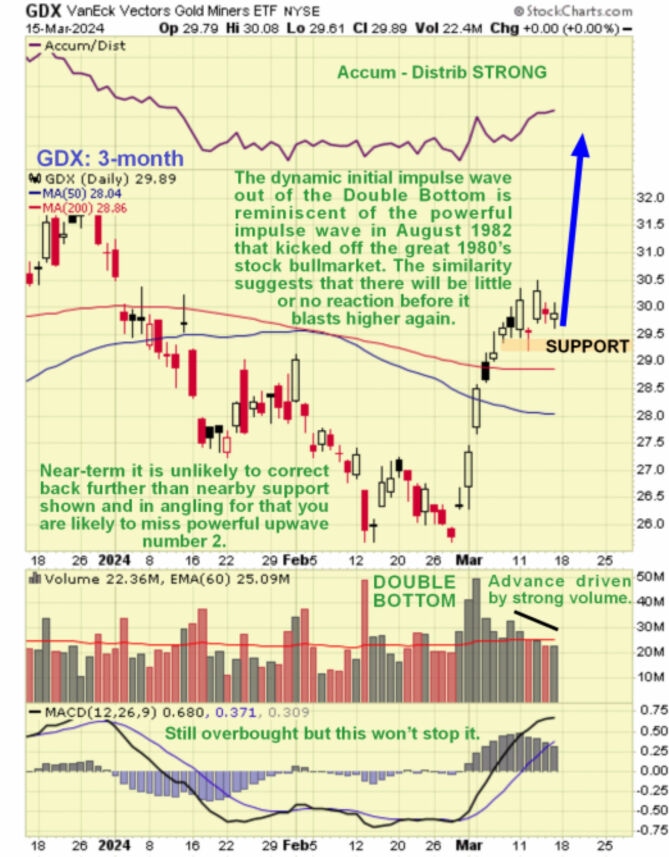
If gold looks like this on its 3-month chart, then what about gold stocks? Gold’s decisive breakout led to a powerful advance by gold stocks, as represented by the GDX ETF, whose 3-month chart shows a dynamic first impulse wave out of a Double Bottom that was accompanied by high volume and gaps — this is very bullish.
This waveform looks very like the first impulse wave in August of 1982 in the broad stock market that marked the start of the great 1980s bull market, which followed a decade of going nowhere (the 1970s). On that occasion, the market only reacted back a little — a lot less than many traders had expected and hoped for — before blasting higher again in a second powerful impulse wave, and it never looked back.
The lesson here is clear — if you are angling for a reaction before buying the sector or adding to positions, you are likely to be disappointed. The most it is likely to react back is to the minor support level near $29.20, and it may not react back anymore at all. From this position, it could blast higher again almost without warning.
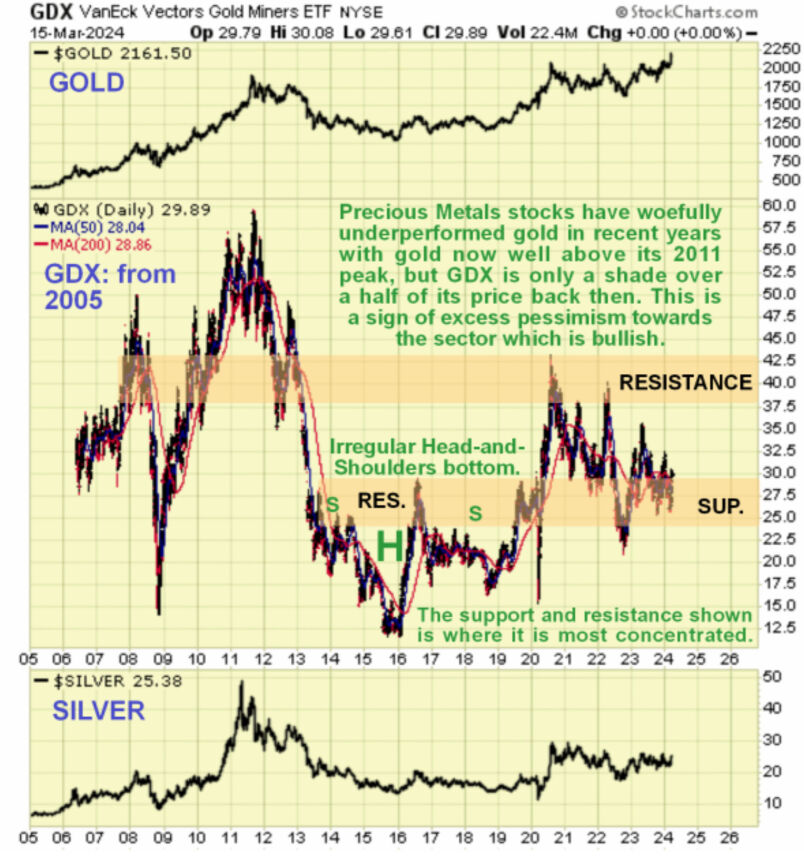
Adding fuel to the fire in a positive sense for gold (and silver) stocks is the fact that they are woefully undervalued relative to gold itself, as our chart for GDX going back to 2005 makes apparent.
Gold is higher now than its 2011 peak, yet GDX, representing PM stocks, is about half the price it was in 2011, so it is clear that PM stocks have a lot of catching up to do and as gold continues to ascend, they will attract growing speculative interest, eventually displaying the positive leverage to the gold price that they are famed for.
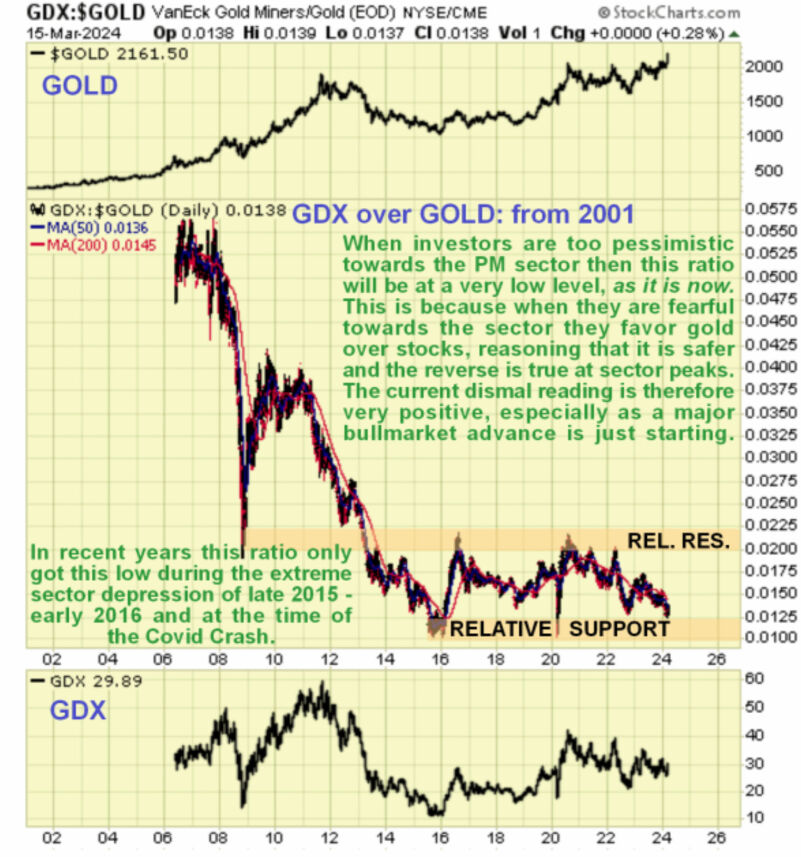
Lastly, we can see how horribly undervalued Precious Metals stocks are relative to gold itself on our chart for GDX, which is divided by gold going back to 2001. Only on two other occasions during the life of this chart have they been so undervalued — once at the nadir of the sector depression late in 2015 and early in 2016, and again at the depths of the Covid crash in the Spring of 2020, which was a freak event when the entire world was in the grip of an orchestrated mass psychosis.
So, given that gold has entered a bull market that is likely to be of awesome magnitude, it should be clear that the upside potential of the better stocks in this sector is truly massive and that, despite their gains of the past couple of weeks they are still at exceedingly good prices compared to where they are headed.
Interested in gold stocks now? Click here to see a list of our sponsored gold companies.
| Want to be the first to know about interesting Gold investment ideas? Sign up to receive the FREE Streetwise Reports’ newsletter. | Subscribe |
Important Disclosures:
-
Statements and opinions expressed are the opinions of the author and not of Streetwise Reports, Street Smart, or their officers. The author is wholly responsible for the accuracy of the statements. Streetwise Reports was not paid by the author to publish or syndicate this article. Streetwise Reports requires contributing authors to disclose any shareholdings in, or economic relationships with, companies that they write about. Any disclosures from the author can be found below. Streetwise Reports relies upon the authors to accurately provide this information and Streetwise Reports has no means of verifying its accuracy.
- This article does not constitute investment advice and is not a solicitation for any investment. Streetwise Reports does not render general or specific investment advice and the information on Streetwise Reports should not be considered a recommendation to buy or sell any security. Each reader is encouraged to consult with his or her personal financial adviser and perform their own comprehensive investment research. By opening this page, each reader accepts and agrees to Streetwise Reports’ terms of use and full legal disclaimer. Streetwise Reports does not endorse or recommend the business, products, services or securities of any company.
For additional disclosures, please click here.
Clivemaund.com Disclosures
The above represents the opinion and analysis of Mr. Maund, based on data available to him, at the time of writing. Mr. Maund’s opinions are his own, and are not a recommendation or an offer to buy or sell securities. As trading and investing in any financial markets may involve serious risk of loss, Mr. Maund recommends that you consult with a qualified investment advisor, one licensed by appropriate regulatory agencies in your legal jurisdiction and do your own due diligence and research when making any kind of a transaction with financial ramifications. Although a qualified and experienced stock market analyst, Clive Maund is not a Registered Securities Advisor. Therefore Mr. Maund’s opinions on the market and stocks can only be construed as a solicitation to buy and sell securities when they are subject to the prior approval and endorsement of a Registered Securities Advisor operating in accordance with the appropriate regulations in your area of jurisdiction.