Gold and Silver Weekly Technical Forecast: Mixed
- Gold bounced off the 50 SMA ahead of the 1774 level, nearing a 50 % retracement of the prior advance
- Silver moves lower, testing a crucial level of support, threatening to trade at lows not seen since 2020
Gold Sees Upside Rejection at 50 SMA, Vulnerable to Move Lower
While this is a technical piece, we cannot disregard the fact that Jerome Powell’s address at the Jackson Hole Economic Symposium came across as rather hawkish – however the Fed chairman did throw a small lifeline to doves mentioning that as policy tightens further it will be fitting to halt the pace of rate rises at some time.
The dollar immediately traded lower but have since then more than reversed those losses and gain some strength into the end of the week. Naturally we saw a concerted move lower in gold.
Gold’s technical landscape is rather complex at the moment, today’s bearish price action has all but erased the recent countertrend rallywhich has gold nearing the August and September 2021 lows at around 1722. The countertrend rally was kept at bay by the 50-period simple moving average (SMA).
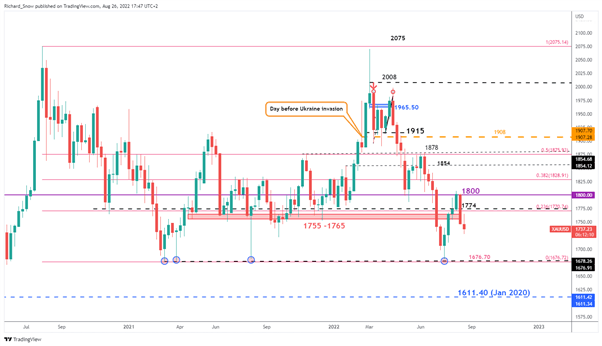
Should markets continue the bearish momentum initiated by the hawkish Powell, we could see gold retest it’s recent lows at around 1676.70 in the coming week. The difficulty with gold at the moment is we are trading in ‘no man’s land’ – somewhere in the middle of the medium-term bullish move initiated after the July low and the bearish retracement of that move which began mid-August.
This current market posture makes it difficult to assess future direction and therefore informs the ‘mixed’assessment of this report.
Gold (XAU/USD) Daily Chart
Source: TradingView, prepared by Richard Snow
Starts in:
Live now:
Dec 21
( 02:12 GMT )

Recommended by Richard Snow
Weekly Commodities Trading Prep
The weekly chart in gold helps present the significant level of support at 1676.70 which has acted as a pivot point for priorexcessive, impulsive bearish moves.
Gold (XAU/USD) Weekly Chart

Source: TradingView, prepared by Richard Snow
Gold-Silver Ratio Maintains Uptrend at Extremes – Suggests Gold Could Sell-off
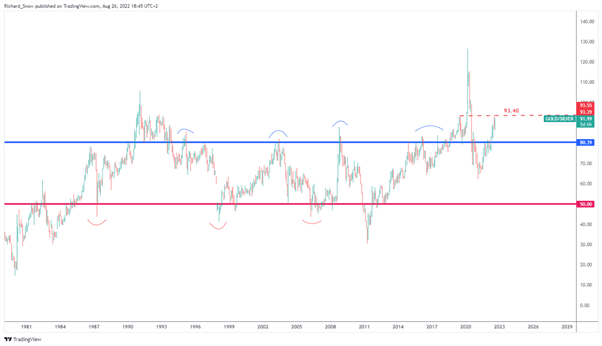
Something interesting to note is the gold-silver ratio, which attempts to serve as an indication of future gold and silver movement. Currently the gold-silver ratio remains around extreme historical levels (80-100) and both gold and silver charts are in a downtrend; meaning we could see gold selling outpace that of silver. Of course, its always prudent to let price action be your guide first and foremost.
For more on the topic, read our dedicated article on the gold-silver ratio.
Gold-Silver Ratio (Monthly Chart)

Source: TradingView, prepared by Richard Snow
Recommended by Richard Snow
How to Trade Gold
Silver (XAG/USD) Provides a Clearer Guide to Bearish Continuation
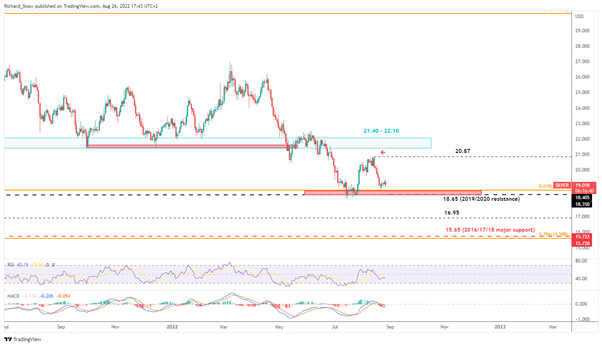
The silver chart on the other hand provides us with a clearerhurdle for bearish continuation. Firstly, the recent advance fell short of testing the zone of resistance (prior support) between 21.40 and 22.10, with the turning point at 20.87.
After Powell’s address, silver nears the zone of support which connects the 61.8 Fibonacci retracementof the 2020-2021 major move; and the 18.65 level referring to the 2019-2020 level of resistance. A break below the zone of support in the coming week would highlight 1695 as the next level of support with 15.65 still a long way away.
Silver (XAG/USD) Daily Chart

Source: TradingView, prepared by Richard Snow
Trade Smarter – Sign up for the DailyFX Newsletter
Receive timely and compelling market commentary from the DailyFX team
Subscribe to Newsletter
— Written by Richard Snow for DailyFX.com
Contact and follow Richard on Twitter: @RichardSnowFX